New Trend in Medicare Growth
|
Under Section 1899A of the Social Security Act, the Centers for Medicare and Medicaid Services (CMS) is required to determine whether the projected five-year average growth in per capita Medicare spending exceeds set targets. The current projected five-year average growth in Medicare per capita spending is 1.15 percent, and the five-year average growth target is 3.03 percent. It is important to note that the current projection is less than the target percentage. Otherwise, a projected growth rate that exceeds the target would require CMS to establish a savings goal for the implementation year. For the 2013 determination year, 2015 is the implementation year. The five-year period to be used for a given determination year consist of the two prior years, the current year, and two subsequent years. For 2013, therefore, the projected five-year average will include growth rates from 2011 through 2015. For 2013, the target is equal to the average of the projected five-year growth, ending in 2015, in the Consumer Price Index for All Urban Consumers (all items; United States City average) and the medical care expenditure category (M-CPI) of the Consumer Price Index for All Urban Consumers (United States City average). The projected five-year average growth in Medicare per capita spending was calculated as the sum of the average per capita spending under each of Parts A, B, and D using the baseline expenditure projections from the President's fiscal year (FY) 2014 Budget. For Parts B and D, the spending was net of premiums. The projected update to the single conversion factor applicable to payments for Medicare Part B requires that the Medicare growth rate be calculated assuming no change instead of the negative percentage that would otherwise apply (i.e., for 2013 Congress acted to override a 27.4 percent negative adjustment to Part B rates, thus keeping current rates essentially level with 2012). The resulting year-by-year growth rates that CMS used in their analysis are shown in the following table (Source: CMS 2013 IPAB Determination).
|
|||||||||||||||||||||||||||||||||||||||||||||||||||||||||||||||||||||||||||||||||||||
Slow Down in Medicare Growth
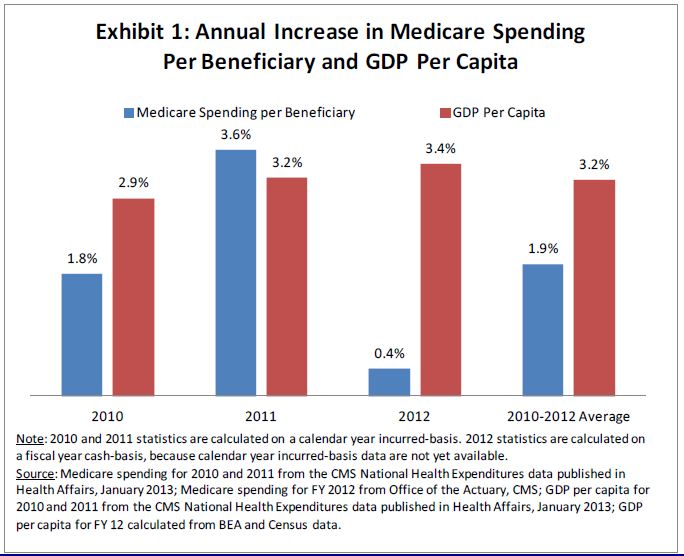
These numbers also reflect recent CMS analysis showing that Medicare spending per beneficiary will continue a pattern of low growth which started in 2010. The White House views these historically low projections on the part of both CMS and the Congressional Budget Office as confirmation that the Affordable Care Act (ACA) has helped to set Medicare on a more sustainable path. The Administration notes that the success in reducing the rate of spending growth has been achieved without any reduction in benefits, and, in fact, Medicare beneficiaries have gained access to additional benefits, such as increased coverage of preventive services and lower cost-sharing for prescription drugs.
We hope that this trend works to minimize the pressure on lawmakers to make even deeper cuts to provider payments. However, it remains important to note that part of this cost saving does indeed result from cuts to providers. While overall this trend in Medicare expenditures is a positive sign, LeadingAge and LeadingAge NY remain strongly opposed to the reductions stemming from both the ACA and “sequestration”. There is no doubt that these cuts negatively impact providers and inevitably will have implications in terms of quality of care and access to services for beneficiaries.
The following CMS exhibit (Source: HHS Office of Planning and Evaluation) illustrates the reduced rate of growth in Medicare expenditures.
Note on Medicaid Global Cap
These numbers also have implications for our state Medicaid program. The M-CPI numbers used to set the Medicare spending targets also reflect projected increases in the State’s Medicaid Global Cap, which is linked to the M-CPI and is mandated to increase as follows:
- $15.9 billion For State Fiscal Year 2012-13 (ended as of 3/31/13);
- $16.5 billion for State Fiscal Year 2013-14; and
- $17.1 billion for State Fiscal Year 2014-15.
The recent State budget extends through March 31, 2015 the Medicaid global spending cap and the “super-powers” granted to the Commissioner of Health to reduce spending if expenditures exceed projections. More specifically, the global cap limits growth in Department of Health (DOH) State Funds Medicaid spending to the 10-year rolling average of the M-CPI, currently estimated at 3.9 percent.
Contact: Patrick Cucinelli, pcucinelli@leadingageny.org, 518-867-8827